CELL WELLNESS
How Much Molecular Hydrogen Matters? Understanding Concentration, Dose and Testing
A hydrogen-water label may show a large ppm number. That tells you about concentration: how much molecular hydrogen, or H₂, is present in a given amount of water. It does not tell you the total amount you drink, how much reaches your tissues or whether it will improve your health.
To understand a product or a study, start with three questions: How much hydrogen was measured? In how much water? And when? The research reviewed here does not establish one best concentration or daily dose for every person and purpose.
Key Takeaways
- ppm and mg/L describe concentration, not the total amount consumed.
- Hydrogen intake depends on both concentration and the volume you drink.
- Dissolved hydrogen can change between production and drinking.
- Product claims need actual measurements under stated conditions.
- A dose used in one study is not a universal recommendation.
Why Hydrogen Concentration Matters
Hydrogen water contains H₂ gas dissolved in water. The useful question is how much is still dissolved when you drink it.
Concentration helps describe the exposure being tested. Without it, two products called “hydrogen water” may be hard to compare. But concentration is only one part of that comparison. A small serving with a higher reading can contain less total hydrogen than a larger serving with a lower reading.
The number is a description of the water, not a promise about the result.
What Do ppm and mg/L Mean?
Milligrams per liter, or mg/L, means the mass of hydrogen in one liter of water. A milligram is one-thousandth of a gram.
Parts per million, or ppm, describes a proportion. When ppm is expressed by mass, 1 ppm means 1 mg per kilogram. For dilute water solutions, 1 mg/L is approximately 1 ppm because one liter of water weighs about one kilogram. This is an approximation for water, not a rule for every liquid or gas. EPA: concentration units.
Some papers use millimoles, which count the amount of a substance using molecules rather than weight. A millimole of H₂ weighs about 2.02 mg. Be careful with the units: mmol/L is a concentration; mmol/day is an amount per day. A mmol/L value can be converted to mg/L using the molecular weight. A mmol/day value cannot become a concentration without a water volume. Do not read either number directly as ppm. NIST: hydrogen molecular weight.
Also check what is being measured. A hydrogen-gas flow rate from a device is not the same as dissolved H₂ concentration in the drinking water. Water pH is a separate property too; it cannot substitute for an H₂ measurement.
Concentration Is Not the Same as Dose
Concentration describes how much hydrogen is present per liter. The amount in a serving also depends on its volume.
The calculation is:
Concentration in mg/L × volume in liters = hydrogen amount in mg
For example, 0.5 liters of water at 1 mg/L contains approximately 0.5 mg of dissolved hydrogen at that measured point.
| Measured concentration | Serving volume | Calculated H₂ in the water |
|---|---|---|
| 1 mg/L | 0.5 L | 0.5 mg |
| 2 mg/L | 0.25 L | 0.5 mg |
| 1 mg/L | 1 L | 1 mg |
These are arithmetic examples, not recommended doses. They assume the concentration stays the same until the water is consumed.
The first two servings contain the same calculated amount. That does not prove they would have identical effects in the body. How quickly they are consumed and what happens after swallowing are separate questions.
How Much Hydrogen Do You Actually Consume?
The best estimate starts with the water you actually drink, rather than a device’s peak output.
If you drink several servings, calculate each one using its measured concentration and volume, then add the amounts. If concentration falls during storage or drinking, a single earlier reading may overstate the amount consumed.
Keep three ideas separate:
- Prepared amount: what was present when the water was made or tested.
- Consumed amount: what remained in the water you swallowed.
- Absorbed exposure: how much entered the body and reached particular tissues over time.
Multiplying concentration by volume estimates the amount in the water. It does not measure absorption or tissue exposure. Nor can a drinking-water dose be treated as equal to an inhaled-gas protocol simply because both involve H₂.
Frequency, preparation and time before drinking belong in a study’s methods. They describe the protocol; they do not automatically establish the best schedule for everyday use.
Why Timing and Storage Matter
Dissolved hydrogen can leave the water. The rate depends on the conditions, so there is no single countdown that applies to every bottle or machine.
The pressure due to hydrogen above the water—its partial pressure—and temperature affect how much H₂ can stay dissolved at equilibrium. Equilibrium is a stable balance between water and gas. NIST: hydrogen solubility data.
A 2022 paper describing home-produced hydrogen water reported different declines in two stored samples. Those examples do not establish a universal loss rate, but they show why a reading taken at production may differ from one taken later. Mizuno and colleagues, 2022.
For a product you plan to store, ask for measurements at the expected time of drinking. The report should state whether the container was unopened, opened and resealed, or poured into a cup. It should also describe container material, temperature and handling. A claim such as “retains hydrogen for hours” needs those details.
What does “saturated” mean?
Saturation is the dissolved concentration at equilibrium under stated conditions. A concentration above that level is called supersaturation. Neither term defines a health threshold. A high reading needs details about pressure, preparation and testing; it is not automatically impossible. NIST: Henry’s law data.
How Should Hydrogen Water Be Tested?
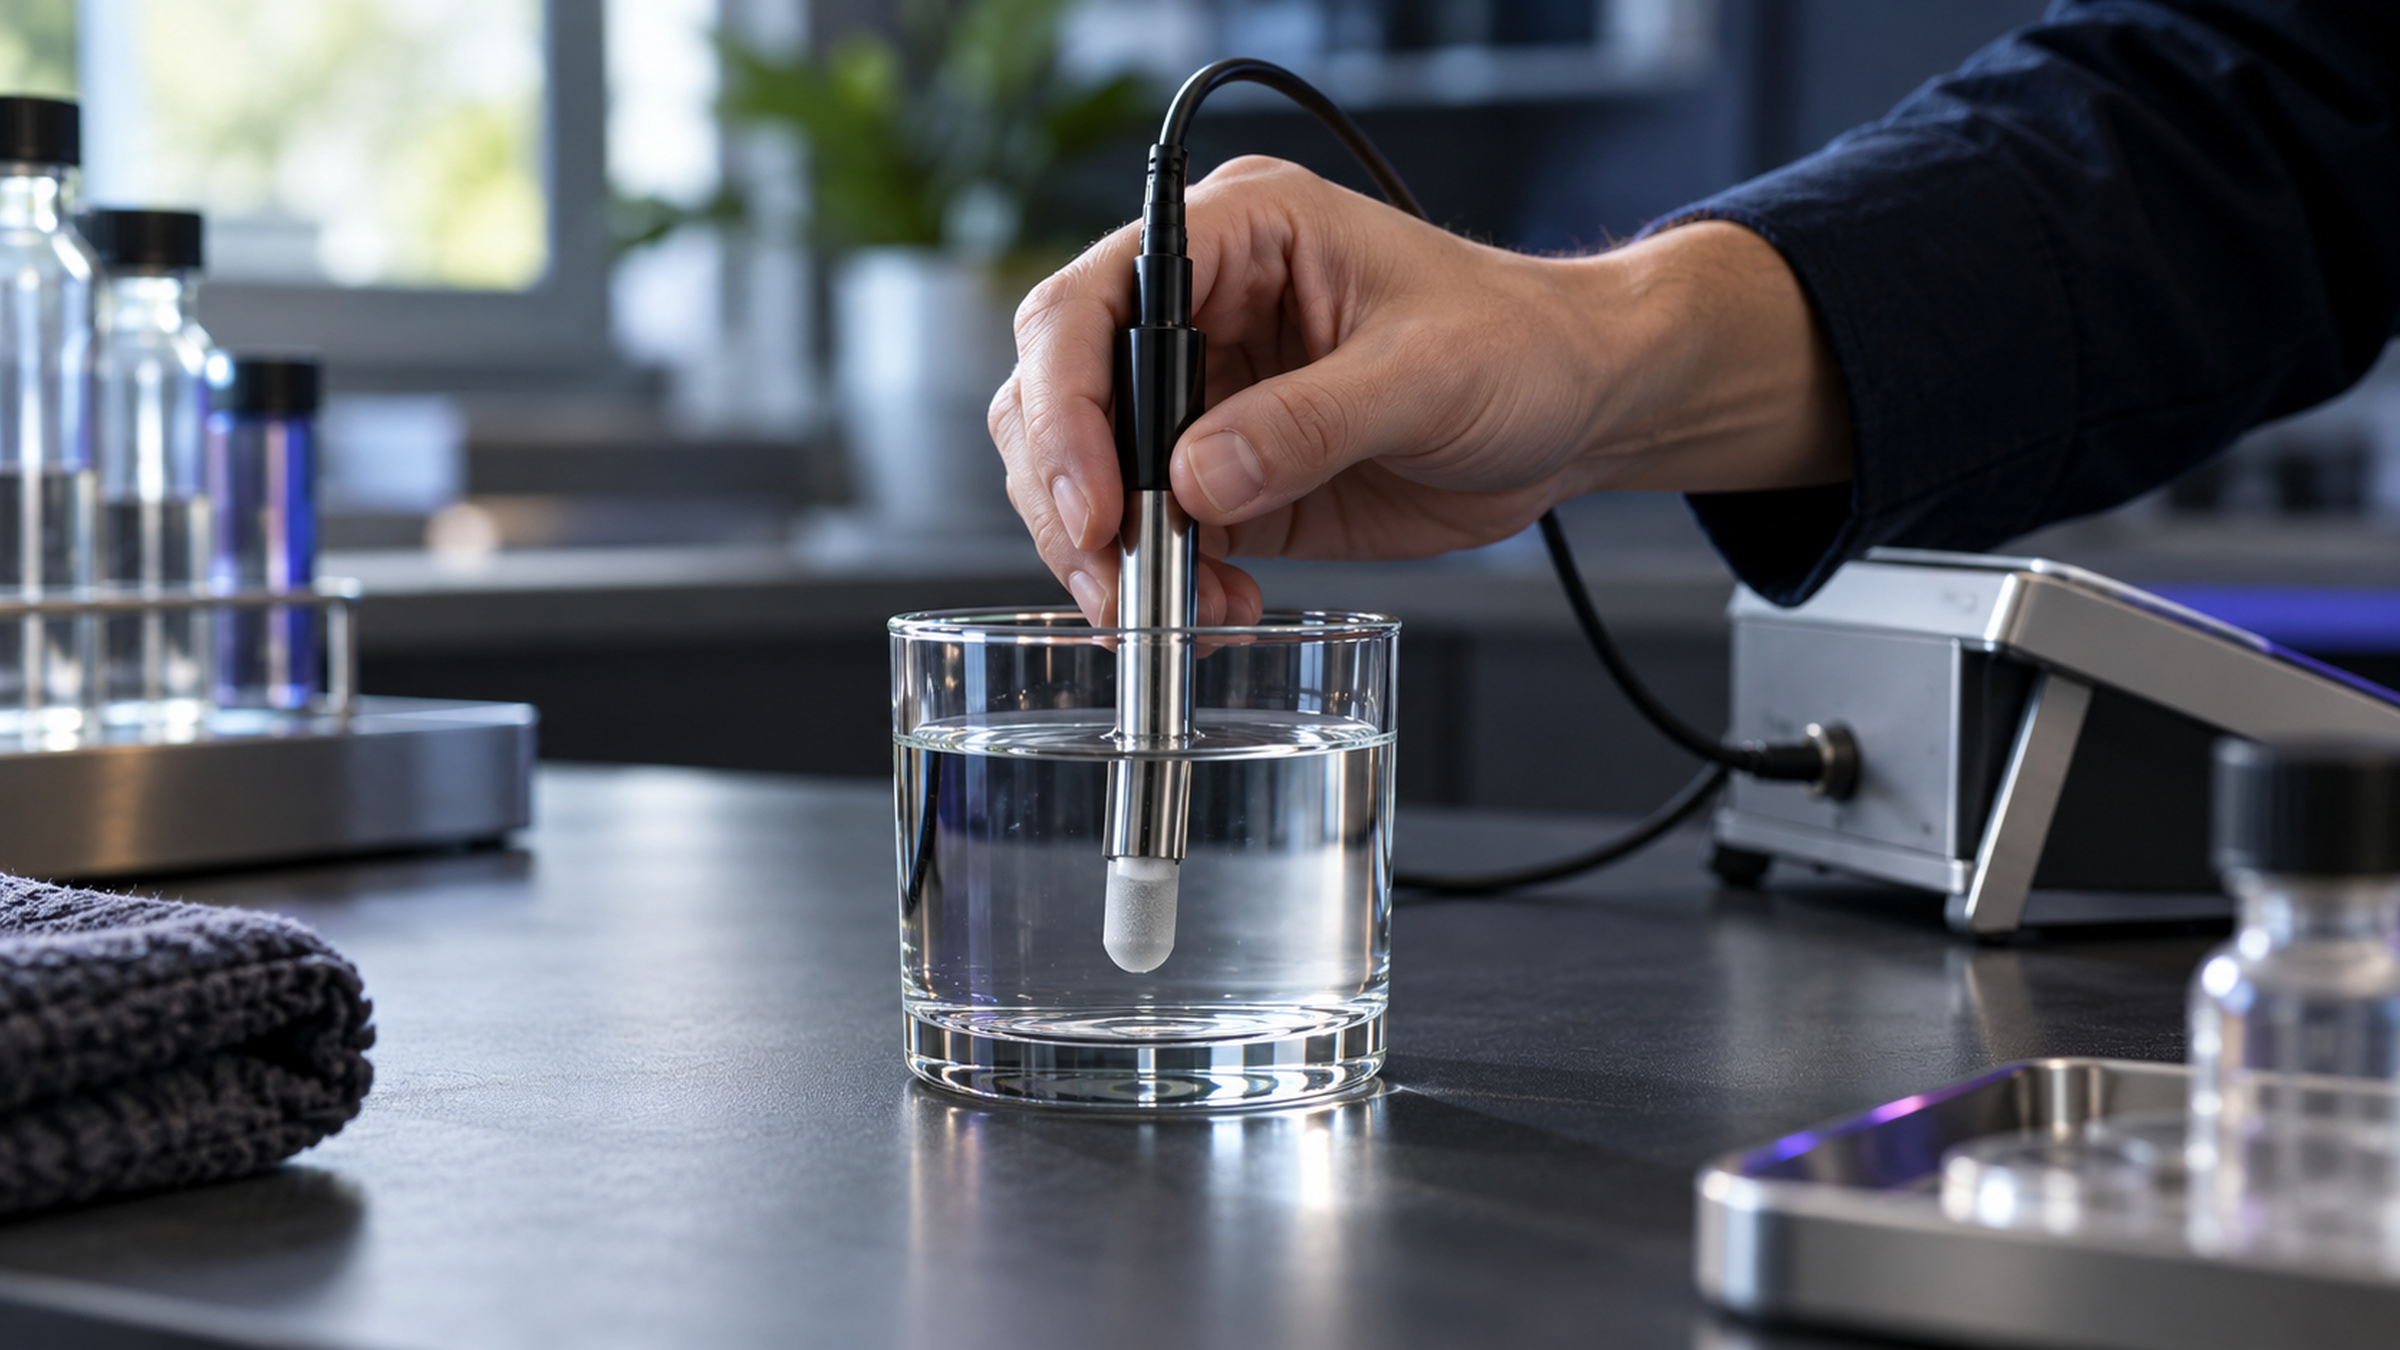
The test should measure H₂ in a representative water sample and explain how that result was obtained.
Research methods include gas chromatography, which separates and measures gases, and hydrogen-specific electrodes or sensors. A 2023 methods study evaluated headspace gas chromatography and a hydrogen microelectrode for water samples. “Headspace” means the gas space above a liquid in a sample container. Liu and colleagues, 2023.
A method’s name alone does not guarantee a reliable result. Ask whether it was checked against known values, works over the claimed range and gives similar results when the test is repeated. Sampling must also account for hydrogen that could escape before measurement.
Some tests use a color-changing reagent. A 2012 laboratory paper evaluated one methylene-blue/platinum method and found that dissolved oxygen affected its results. That supports checking a test’s limits, rather than assuming all drop tests are equally accurate. It is not a recommendation to add test chemicals to drinking water. Seo and colleagues, 2012.
Is ORP a hydrogen test?
An ORP reading is not a reliable substitute for a direct hydrogen-concentration measurement. ORP, or oxidation-reduction potential, is a voltage measured between a sensing electrode and a reference electrode. It reflects the water’s tendency to take part in reactions that transfer electrons.
A 2022 theoretical analysis showed that pH and temperature can strongly affect the reading. A more negative ORP does not reliably mean more dissolved hydrogen. Some devices display a calculated H₂ value based on ORP, so ask what the meter actually measures. This analysis concerns measurement chemistry, not proof of a health effect. LeBaron and Sharpe, 2022.
What Should You Look for in a Machine or Product?
Look for a report that connects the advertised number to normal use.
| Claim or result | What it tells you | What still needs checking |
|---|---|---|
| Theoretical output | What a design or reaction could produce | How much reaches the drinking water |
| Laboratory specification | Performance under stated test conditions | Whether those conditions match your use |
| Measured concentration | H₂ found in a tested sample | Method, timing, repeatability and sample handling |
| Concentration at drinking | H₂ remaining under the tested drinking conditions | Serving volume and evidence for the health claim |
Useful questions include:
- Was the water itself tested, or only the gas the machine produced?
- What water volume, temperature and preparation time were used?
- Was the sample tested immediately, or after a normal delay before drinking?
- Does “up to” describe a peak result or a repeatable result?
- Were measurements repeated across servings or units?
- What method was used, and was the test performed by an outside laboratory?
- Does the report cover storage and pouring, not just production?
- What ingredients does a tablet add, and what maintenance does a machine require?
- Does the human research use a comparable preparation, serving volume and schedule?
A higher reading cannot answer all these questions. Independent testing can support a concentration claim, but it does not by itself prove a health benefit.
Is More Hydrogen Always Better?
A higher concentration means more hydrogen per liter at the measured point. It does not establish a larger health benefit.
To test a dose-response relationship, researchers need to compare different amounts under otherwise similar conditions. Comparing unrelated studies is not enough. Their participants, water preparations, schedules and outcomes may all differ.
The human examples below do not establish a universal minimum effective concentration. They also do not show that everyone should aim for the highest available number. A change in cells or an animal experiment would not settle the best drinking-water dose for people either.
What Does Human Research Actually Tell Us About Dose?
Human studies show what was tested in a particular setting. Their protocols are useful context, not ready-made consumer instructions.
| Study | Preparation and exposure | Finding and dose limitation |
|---|---|---|
| Ishibashi and colleagues, 2012: 20 completers with rheumatoid arthritis; open-label pilot | Special gas-generating setup in a sealed bottle; 530 mL/day at a reported 4–5 ppm, checked with a hydrogen sensor; consumed within one hour of opening. Two four-week drinking periods separated by four weeks without the intervention. | A urine marker of oxidative stress, assessed in 18 participants, and a disease-activity score improved. No placebo group or lower-dose clinical group established cause or an optimal dose. |
| LeBaron and colleagues, 2020: 60 adults with metabolic syndrome; randomized, double-blind, placebo-controlled trial lasting 24 weeks | One hydrogen-producing tablet in 250 mL water at 12–18°C, three times daily; 750 mL/day, drunk soon after dissolution. Gas chromatography was used to test tablet output. The paper reports more than 5.5 mmol H₂/day, a daily amount rather than a ppm value. | Several blood-sugar, lipid and inflammation measures improved versus placebo. There was no lower-dose hydrogen group, so the trial did not establish that this amount was best. |
Sources: Ishibashi and colleagues, 2012; LeBaron and colleagues, 2020.
Metabolic syndrome is a group of risk factors involving measures such as blood sugar, blood pressure and waist size. These participants are not interchangeable with healthy shoppers or athletes.
Also notice the reporting limits. Testing a preparation’s output does not document every participant’s glass at the moment of drinking. When a paper reports a daily amount, do not silently relabel that number as ppm. When the measurement timing is unclear, keep that uncertainty visible.
The Bottom Line
Read a hydrogen-water number as the start of the description. Check the units, serving volume, preparation, measurement method and time before drinking.
Concentration × volume estimates hydrogen in the water. It does not calculate a proven health benefit. The most useful product claim is one backed by clear measurements under conditions that match actual use. The reviewed evidence does not establish one best concentration or dosing schedule for everyone.
References & Further Reading
- U.S. Environmental Protection Agency. Data Reporting Questions. Archived official guidance on aqueous concentration units.
- National Institute of Standards and Technology. Hydrogen. NIST Chemistry WebBook, SRD 69. Molecular weight and Henry’s law solubility data.
- Mizuno K, et al. Antioxidant effects of continuous intake of electrolyzed hydrogen water in healthy adults. Heliyon. 2022;8(11):e11853. DOI: 10.1016/j.heliyon.2022.e11853. Observational paper; cited here only for storage descriptions.
- Liu B, Jia X, Xue J, Qin S. Determination of Hydrogen Concentration in Hydrogen-rich Water by Headspace Gas Chromatography and Hydrogen Microelectrode. Science and Technology of Food Industry. 2023;44(2):352–357. DOI: 10.13386/j.issn1002-0306.2022030360. Laboratory methods study; Chinese article with English abstract.
- Seo T, Kurokawa R, Sato B. A convenient method for determining the concentration of hydrogen in water: use of methylene blue with colloidal platinum. Medical Gas Research. 2012;2:1. DOI: 10.1186/2045-9912-2-1. Laboratory methods study.
- LeBaron TW, Sharpe R. ORP should not be used to estimate or compare concentrations of aqueous H₂: An in silico analysis and narrative synopsis. Frontiers in Food Science and Technology. 2022;2:1007001. DOI: 10.3389/frfst.2022.1007001. Theoretical measurement analysis, not a clinical trial.
- Ishibashi T, et al. Consumption of water containing a high concentration of molecular hydrogen reduces oxidative stress and disease activity in patients with rheumatoid arthritis: an open-label pilot study. Medical Gas Research. 2012;2:27. DOI: 10.1186/2045-9912-2-27. Small uncontrolled human study.
- LeBaron TW, et al. The Effects of 24-Week, High-Concentration Hydrogen-Rich Water on Body Composition, Blood Lipid Profiles and Inflammation Biomarkers in Men and Women with Metabolic Syndrome: A Randomized Controlled Trial. Diabetes, Metabolic Syndrome and Obesity. 2020;13:889–896. DOI: 10.2147/DMSO.S240122. Placebo-controlled human trial, not a dose-ranging comparison.